From four products to one unified experience
Audience Intelligence App. Every Audiense customer now starts in one place, and a new account gets to its first report in under a day instead of three.
- Role
- Design lead of a cross-functional task force
- Team
- 2 designers, 1 PM, 1 tech lead, 7 engineers
- Timeline
- Jan 2025 – Feb 2026, shipped in 4 releases
- Scope
- 4 products, 1 shell, 1 report model
- Separate apps merged into one product and one login
- 4 → 1
- Separate apps merged into one product and one login
- Days to first report for a new account (median)
- 3.2 → 0.9
- Days to first report for a new account (median)
- New reports that combine two or more channels
- 6% → 27%
- New reports that combine two or more channels
- Navigation and "where is my report" support tickets
- −38%
- Navigation and "where is my report" support tickets
Source: Mixpanel product analytics, comparing new accounts and new reports from the year before the project with those after the last release in Feb 2026. Support tickets by tag, quarter over quarter.
The problem
Audiense had grown into four products: two built in-house and two that came with acquisitions. Each one had its own name, navigation, and report format. They shared data underneath, but a customer could not see what one product held, so the work stopped at the edge of each app.
The cost showed up everywhere. Sales pitched four products with overlapping names. Support answered the same "where is my report" question every week. Only 6% of new reports combined more than one channel, which is exactly the analysis our biggest customers pay for.
The bet
Not a rebrand and not a big-bang rewrite. One shell first, so every product lives behind the same front door, then one report model, so results can be combined. Each release had to be useful on its own, and nothing could break for the accounts already paying.
Key decisions
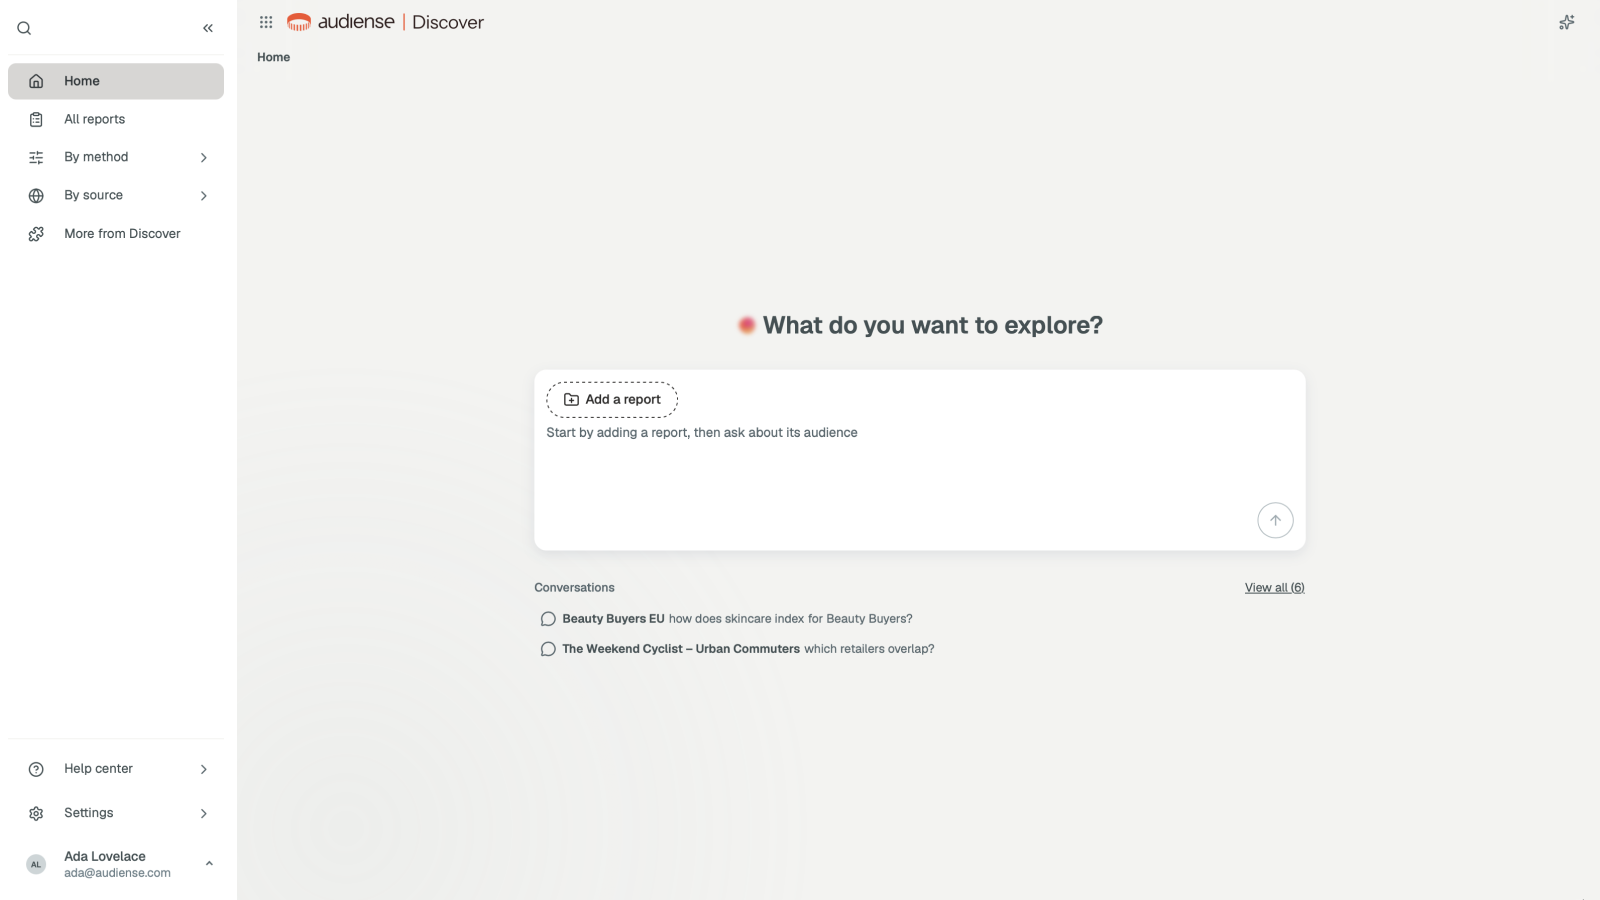
1. One front door, not a product switcher
The first proposal from the business was a switcher in the header. I pushed back: it would have kept four products and added a menu. Instead, the app starts by asking what you want to explore, then picks the right report for it. Product names disappear from the main path. In testing with 12 customers, 10 created the right report type on the first try, against 4 of 12 with the switcher prototype.
2. One report model, so results can be combined
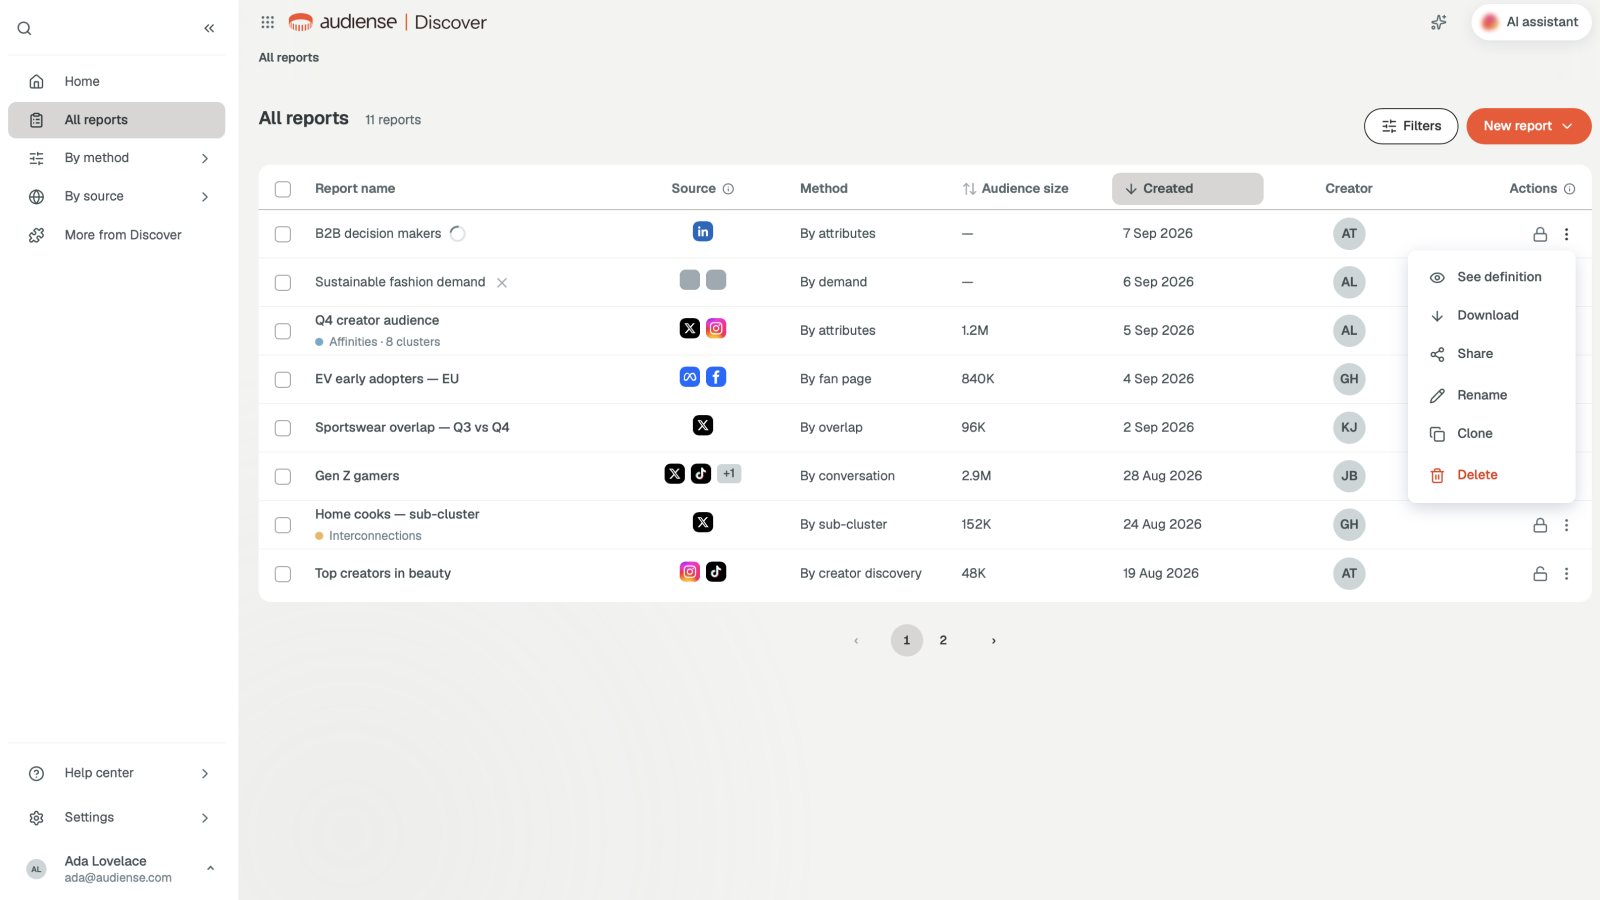
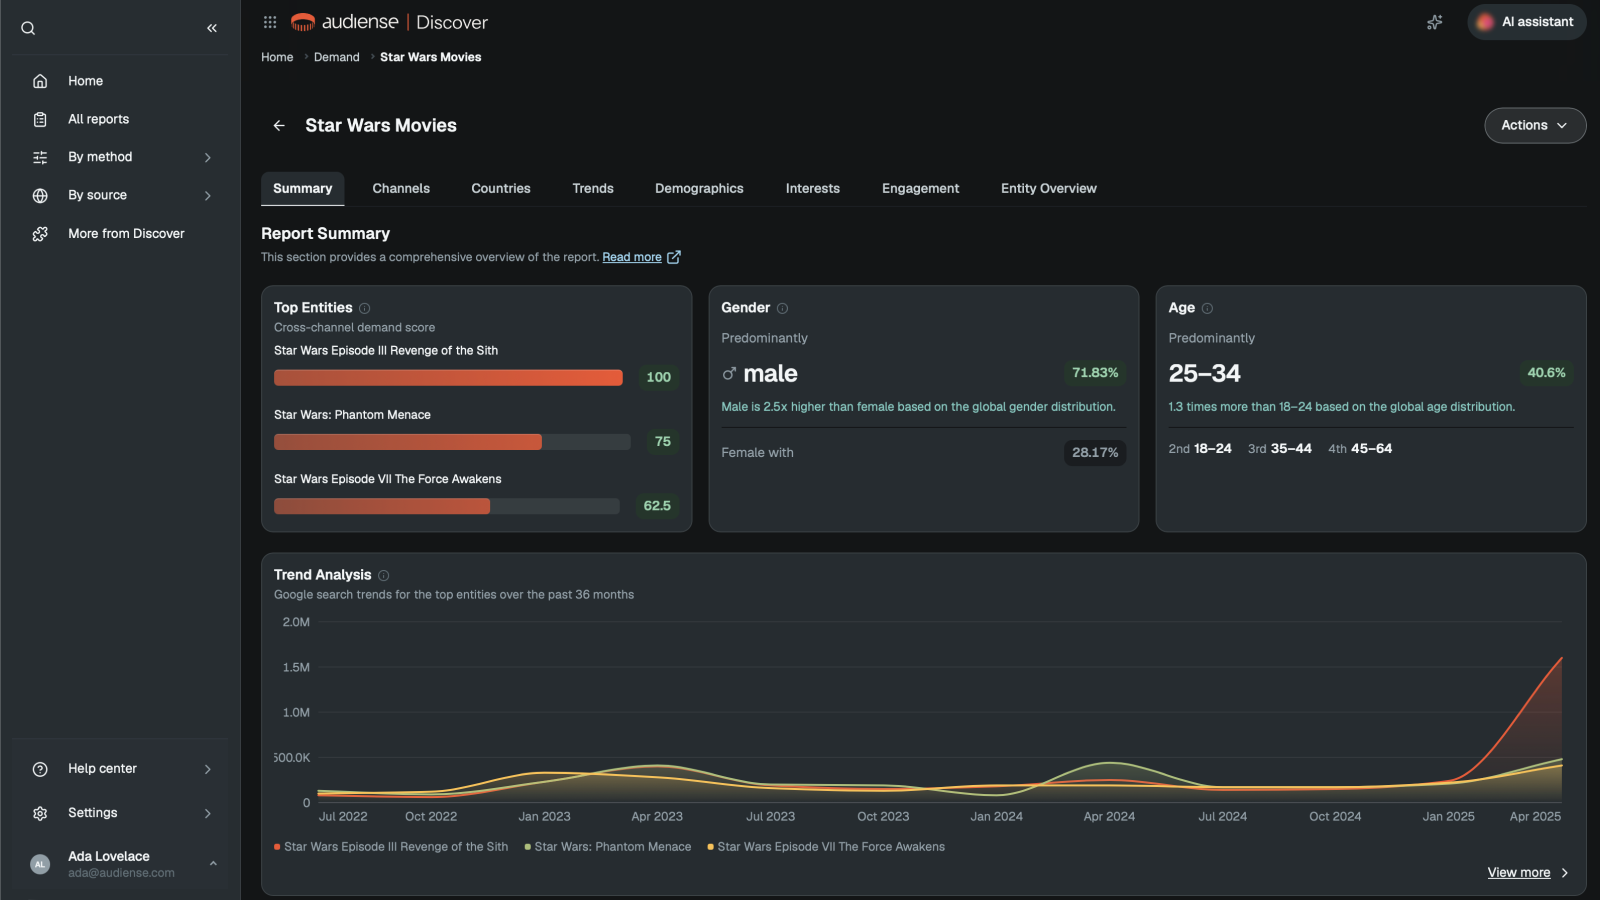
Every report, from any source, now has the same anatomy: source, method, audience size, then summary, channels, countries, and trends. That constraint was the hardest negotiation of the project, because two teams had to give up custom layouts. It is also what made cross-channel reports go from 6% to 27%.
3. Ship in slices, then add the copilot
Four releases over thirteen months, each one useful without the next. The copilot came last on purpose: an assistant needs one consistent report model to read, and before the unification there were four.
- Mar 2025The shell. One login, one navigation, every existing product inside it.
- Jun 2025One report list across sources, with the same source, method, and size columns.
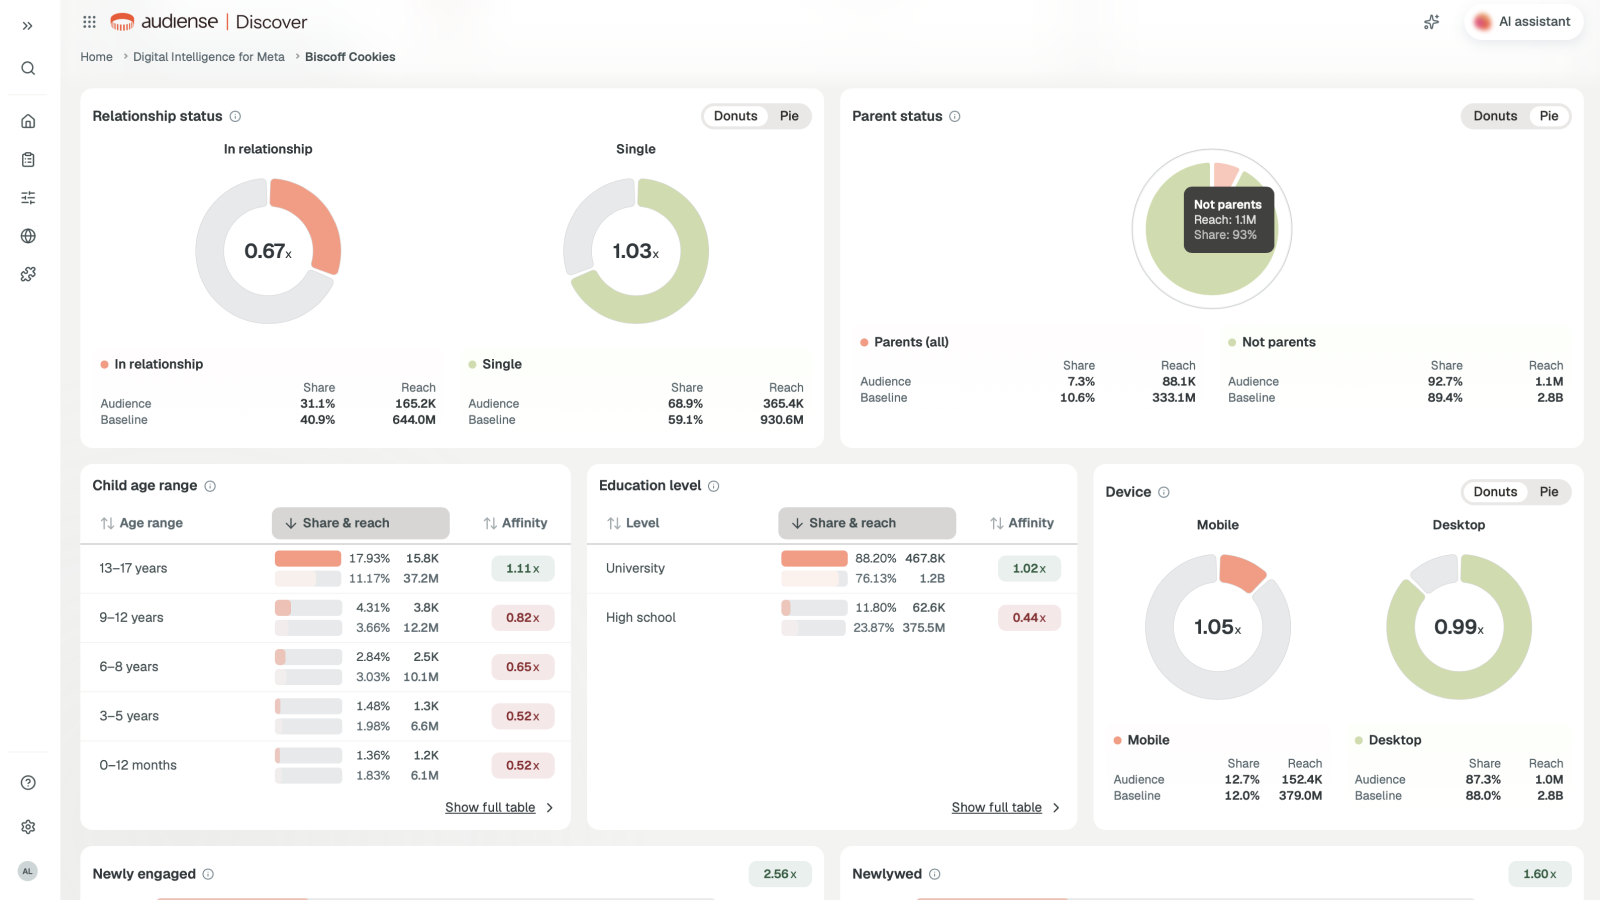
- Oct 2025Digital intelligence for Meta and LinkedIn, rebuilt inside the app instead of next to it.
- Feb 2026The AI copilot, which works because there is now one report model to read.
What stayed out, and why
Saying no was part of the design. Two products did not move in.
Social listening for X
Different users, different job. Merging it would have added a mode switch for 9% of accounts and confused the rest.
Audience intelligence for X and TikTok
It stays on its own stack until the data pipeline is shared. We designed the slot for it, so it arrives as one more source, not a fifth app.
Results
Adoption
Weekly active accounts using more than one data source went from 14% to 41% in the six months after the report list shipped.
Sales
One product to demo instead of four. The standard demo went from 45 to 25 minutes, and sales stopped needing a slide to explain product names.
Support
Tickets tagged navigation or "can't find report" dropped 38% quarter over quarter after the shell shipped.
Delivery
Three front ends became one, built on the design system. New report types ship as a template, not a project: the Meta rebuild took 7 weeks against a 4-month estimate.
What I did
- Information architecture and navigation for the whole suite
- The shell, its empty, loading, error, and permission states
- The rollout plan: which product moves in first, and what stays out
- Weekly design review with the task force and the CPO
What the team did
- Report pages and the summary view: a product designer on the team
- Data model and migration: the tech lead and backend engineers
- Pricing and packaging for the unified product: product and sales